
So... What is the relationship between Employment and Inflation, how proportionate are they in the long term and the short term, also what research and experiments have been carried out for this theory and who backs it up?

Before we progress, it might help to know a bit about Employment and Inflation,
- Checkout my article on inflation here
- Checkout my article on Employment here
- There are 2 simple Ideas behind this statement,
1) Cost Push Inflation
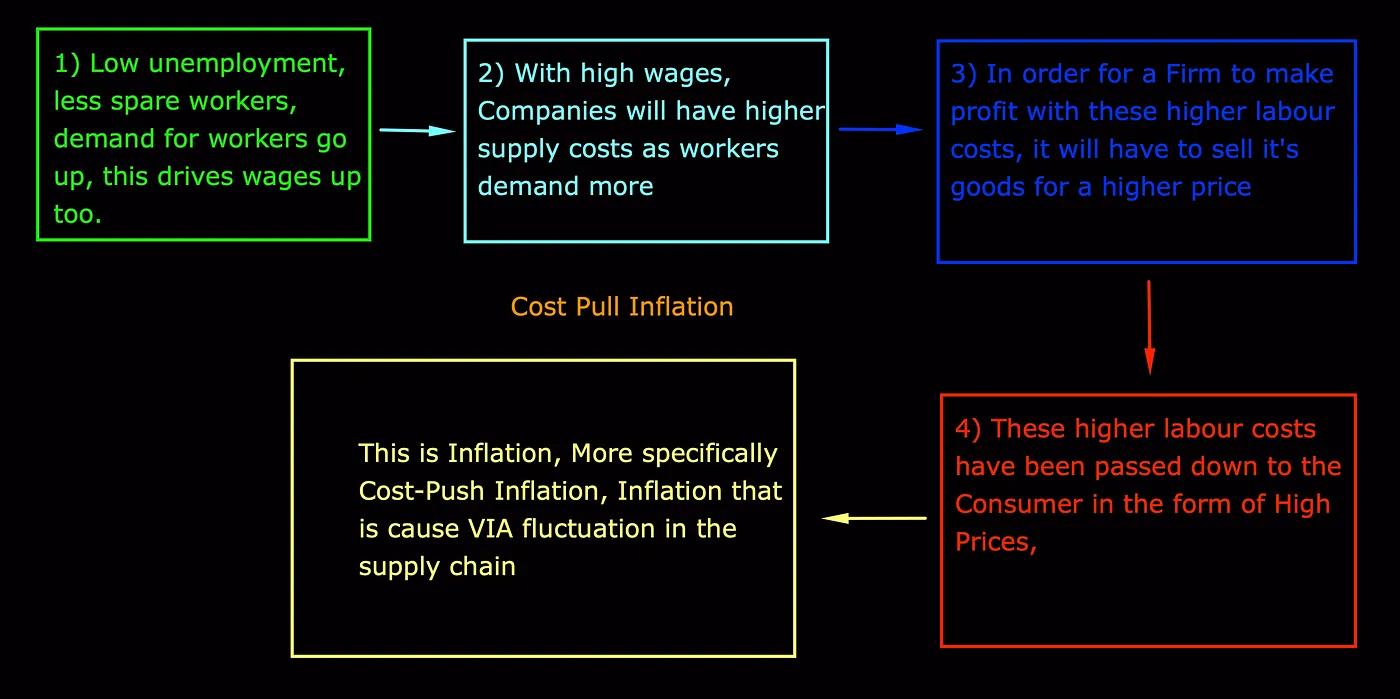
- The Low Unemployment leads to a shortage of ‘Free workers’ (AKA Spare Workers), this leads to an increase of demand for the workers which drive up Wages.
- With these higher wages, the supply costs will be much higher as workers will demand more
- In order for a firm to make a profit, they will have to sell their product for a higher charge
- The Higher labor cost gets passed on to the consumer, this is known as Cost push Inflation
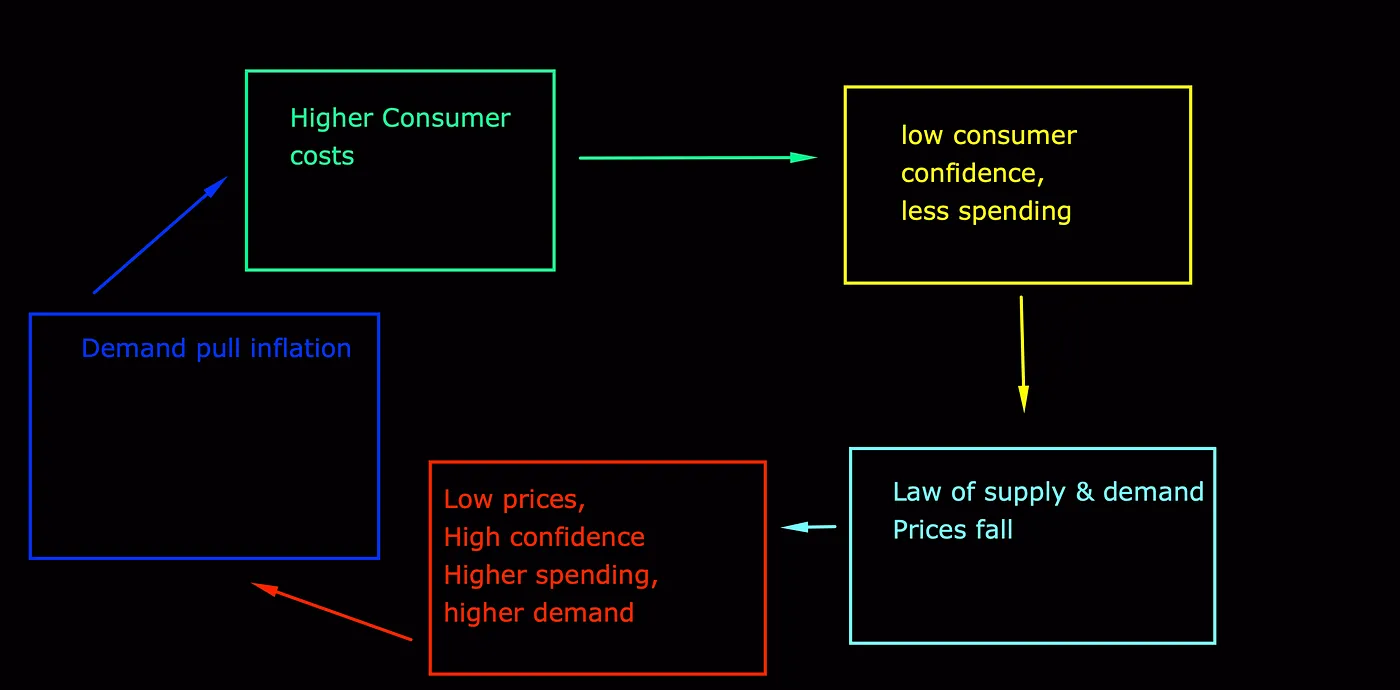
This could turn into an endless loop unless the Central bank acts,
- Prices are up,
- Consumers have less Free money; hence they spend less,
- according to the Laws of Supply and Demand, the prices will then fall,
- leading to more spending
- which then increase Demand
- which brings back prices up.
but of course, this is just ceteris paribus, it is highly unrealistic in the real world due to several other factors.
2) Demand Pull inflation
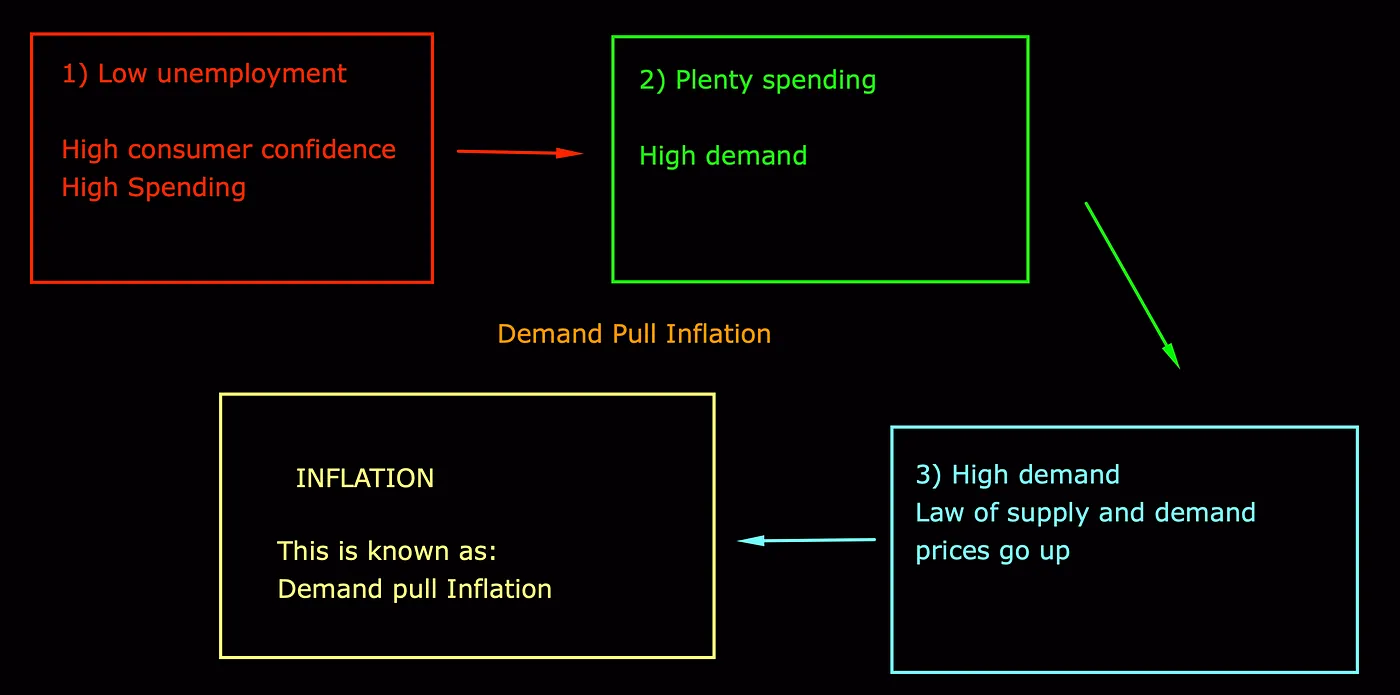
It occurs as so
- Low unemployment increases demand for workers which pushes up wages
- these high wages increase consumer confidence which lead to higher spending
- these higher spending will lead to higher demand, and according to the law of supply and demand, prices go up
- and with high prices, that’s inflation
While we are in this topic, let’s go over another Types of inflation Too,
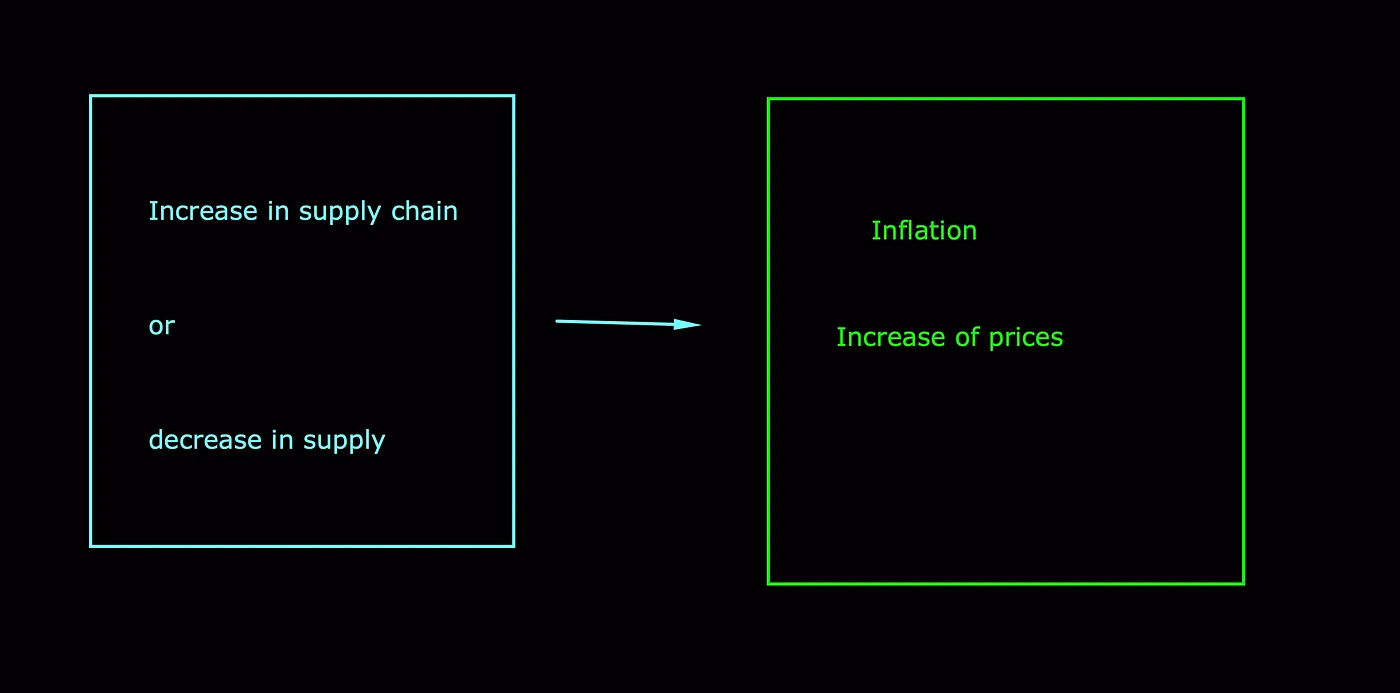
Cost Pull Inflation
This type of inflation occurs when a cost in the supply chain increases but the demand for the good remains the same or when the supply of the good decreases, but the demand remains the same
Now let’s dive into some Economics theory.
NRU — Natural rate of Unemployment
The NRU is the natural rate of unemployment, this is the ratio of unemployed people in the labor force.
the formula is: FU = Frictionally unemployed SU = Structurally unemployed LF = Labor force
You add the Frictionally unemployed with the Structurally unemployed and divide the total by the Labour force
NRU = (FU + SU) ÷ LF
NAIRU — non-accelerating inflation rate of unemployment
this is the lowest rate of unemployment that can exist in the long run that won’t lead to changes in inflation
For example, if the NAIRU is at 7%, Unemployment below 7% will lead to inflation but Unemployment above 7% will not
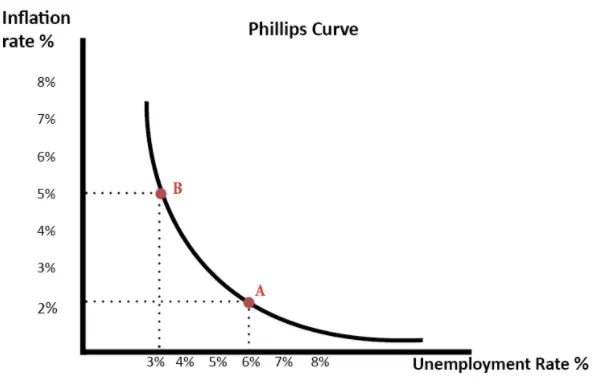
Short run Phillips Curve
The Phillips Curve demonstrates the relationship between the two factors, it shows that there is a trade of between the two.
Economist A.W Philips, plotted historical data of unemployment and inflation and was able to derive that as inflation falls, unemployment rises, and vice versa.
So, if a government wants to reduce Unemployment, they could introduce policies to boost aggregate demand, but they must be prepared to face higher inflation.
Keynesian Opinion
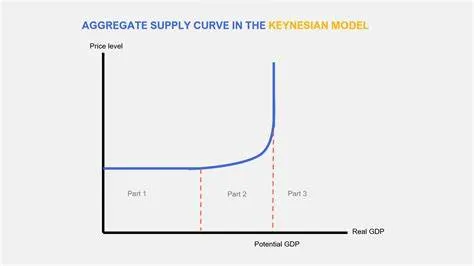
The Phillips curve shows the same idea as the Keynesian LRAS.
Anything before the 1st red line (end of part 1), output is low and unemployment is high, workers take on low wages and there won’t be much effect on price.
In the area of Part 2, Output increases, unemployment falls, and prices start to rise, this is the same relationship as the Phillips curve.
Embedded Inflation due to Expectations and Stagflation
Adaptive Expectations
The Short run Phillips curve is slightly ceteris paribus, many other economists do not believe that it is just this simple, for example, when inflation rises, people don’t expect it to go soon, they expect it to stay for a while hence they change their behavior for this, this is known as Adaptive Expectations, this is people using the past to predict the future, EG: if inflation is high today, many would expect the same for tomorrow, this is how inflation could become embedded into an economy, even if the government is trying to bring it back.
1970s Stagflation
For example, in the 1950s and 1960s, governments put their faith in the Phillips curve and tried to manage the tradeoff between inflation and unemployment with it,
However the relationship between the two factors started to break down, the economy went into a stage of stagflation, this is where there is a stagnant economy with high unemployment, low growth and high inflation.
Monetarist economists put forward a reason for this, they said that the Phillips curve only looks at the current rate of inflation and not the expected rate of it, hence they made the LRPC, Long run Phillips curve.
Long run Phillips curve
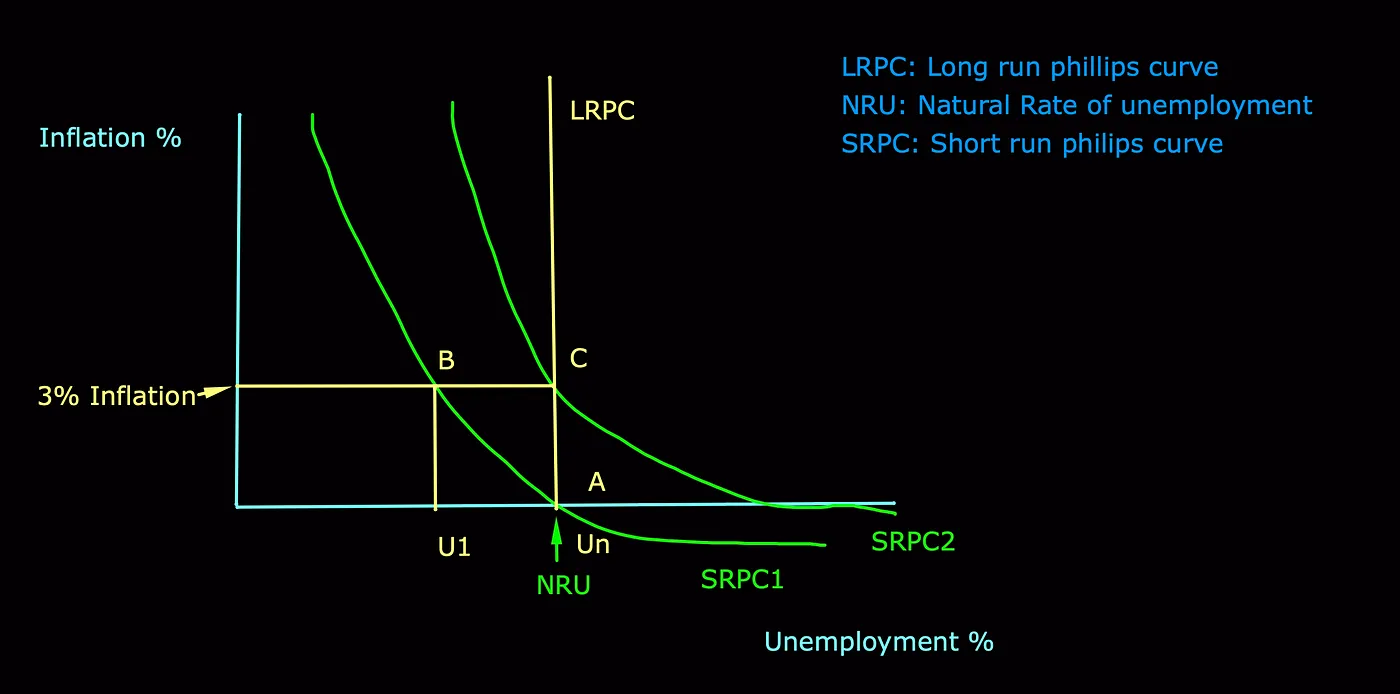
in this diagram, let's explore the scenario,
Assume we are at point A, Inflation is 0, and unemployment is at the NRU, at this point, people will think inflation and employment will remain here, they will act as so hence this will influence worker wage negotiations, However, this will lead to an increase in aggregate demand, and unemployment will fall down to U1, below the NRU This will cause wage demands to go up, leading to a cost push inflation, which raises inflation to point B, at 3% Now people will believe inflation will stay up here and act accordingly, future wage negotiations will be based on 3% inflation These higher wage demands will mean that firms are reluctant to hire more workers, this shifts the SRPC to SRPC2 and brings the unemployment rate back to the NRU, Point C, now even though unemployment has returned to the NRU, Inflation hasn’t gone down, this is an example of how inflation could become embedded into an economy.
Is there actually a trade-off between inflation and unemployment?
Monetarist economists say that there isn’t any long-term link on inflation and unemployment.
The above example was a result of an increase in aggregate demand, and the SRPC shifted too, Monetarists say that no matter how it shifts, unemployment will always return to the NRU,
this is why they suggest that the LRPC is always at the NRU as a vertical straight line.
Many other economists say that there isn’t even a correlation in the short run too, but we’ll not go there in this article.
The End

This was one article that ‘dragged on’ for a much longer time than i anticipated, but It went through in the end, I hope this has helped you at least understand the basics of this relationship or revise something,
Any corrections / improvements/ Positive & negative suggestions, please drop them in the comment, Once again, Thank you :), Спасибо и до новых встреч (Thank you and see you again).